“Usually the team that scores the most points wins the game.” – John Madden
Update: If you’d like to jump right to part 2 of this series you can do so here where I turn the regression analysis into a really basic data science model.
I’m taking the first steps of an 18-24 month journey with a beginner’s mindset to establish and grow my data science skills. What better way to begin to learn new skills in March than by applying them to March Madness?!
I’ve learned the framework for any good data science problem looks something like:
- What’s the question we want to answer?
- What is the training data set we’re going to use? How are we going to wrangle the data?
- Exploratory data analysis including identifying relationships.
- Pre-processing and training data development
- Modeling
- Conclusions, documentation, presentation, clean up.
In this post, I’ll tackle the first four steps of this framework and share a few conclusions. I’ll also note right up front, while I’m beginning to dive into the technical stack that helps enable data science (Jupyter, Python, Pandas, Numpy, Pyplot, and Seaborn), the problem I tackled could be better classified as a standard “statistics” problem. It’s definitely a “small data” problem and I haven’t built the model yet – so I don’t think it’s accurate to claim this work as anything resembling “data science” yet.
I’m just starting out on this journey. There’s probably so much wrong with my thinking here. I would love those with more experience to offer criticism and point out the flaws in my thinking and application. I tried not to over-complicate the technology, so I used Excel. The data set could be loaded into a structured database or something even more complex – but why? Let’s keep things as simple as possible. For the modeling portion I may load it into MySQL or Postgres.
What’s the problem we want to tackle? How do we pick round 1 tournament winners? Why do we only care about round 1? Simple. I’ll be in Las Vegas actually betting on the first round games. So let’s find an asymmetric advantage, put it to use, and benefit from it! That’s the goal any way. Here are a few of my starting hypotheses:
- In 2018 the NCAA retired the strength of schedule measure, known as RPI, and replaced it with NET rankings. The basis of NET rankings is bucketing wins into quads. The NET rankings take into account, game results, strength of schedule, game location, scoring margin, offensive and defensive efficiency, and quality of wins and losses. I won’t explain all of this here, but my hypothesis is: does playing in and winning quad 1 games correlate with winning a first round tournament game? This hypothesis was born out of frustration seeing a team like Dayton ranked in the top 5 nationally, but having played in only three quad one games and my beloved Fighting Illini playing in 15+ quad 1s and being ranked #23. I’m just not convinced that teams that play in very weak conferences should be in the national conversation, sorry Dayton. P.S. Dayton’s strength of schedule ranks 94th nationally. Dayton’s non-conference strength of schedule ranks 185th nationally. Sorry, that’s not a #3 ranked team in my book.
- I dove into the quad 1s and it got me thinking, what factors correlate strongest to winning in the first round? What’s the strongest correlation I can find? Offensive rebounds? Turnovers? Defense? Three point shooting? Getting to the line and actually hitting free throws? I ran these all down!
Okay, let’s get to it!
What’s the training data we’re going to use? How do we wrangle the data? We’re going to grab and collate data from a variety of sources – let’s start by grabbing the 2019 NCAA first round tournament results. Let’s also grab the Vegas Money Line odds for these games. I like to bet the Money Line – just picking winners and losers – I don’t mess with the spread. We’ll also grab the quad 1 results for each tournament team last year. We’re going to grab the KenPom.com data and with a premium subscription from KenPom, we’re also going to grab the “Four Factors.” I won’t exhaustively describe all these factors, but suffice it to say, that I hopped right on the shoulder’s of giants and grabbed the absolute cutting edge of basketball stats that I could find:
- Adjusted Efficiency Margin is the difference between a team’s offensive and defensive efficiency. It represents the number of points the team would be expected to outscore the average D-I team over 100 possessions.
- Effective field goal percentage is like regular field goal percentage except that it gives 50% more credit for made three-pointers.
- Turnover percentage is a pace-independent measure of ball security.
- Offensive rebounding percentage is a measure of the possible rebounds that are gathered by the offense.
- Free throw rate captures a team’s ability to get to the free throw line.
- Quad 1 Wins wins over “good” teams – top 30 wins at home, top 50 wins at a neutral site and top 75 road wins. We test for wins, attempts, wins + attempts, winning percentage, win margin, and win + attempts margin.
There are breakouts for offensive efficiency, defensive efficiency and the “Four Factors” also apply to offense and defense. Additionally, we include national rankings for each category as well as quad 1 data. All in, we’re looking at 37 different factors to determine correlation.
Let’s write some code!
I used Pandas to outer join data from three different spreadsheets matching the data according to team name. This was very, very awesome and easier than collating in Excel directly and much faster than doing it by hand. The code below reads in a spreadsheet matches the team name and spits out a new spreadsheet with all the data matched up. Sweet!
Edit: I should have done either a left join or an inner join. The outer join included everything that matched and everything that did not match. An inner join or left join would have just included the data about the rows that matched. Not a big deal, but a learning point that would have resulted in data wrangling and cleanup time for me.
import pandas as pd
df = pd.read_excel("kenpom19.xlsx","summary19_pt")
df2 = pd.read_excel("offense19.xlsx","offense19")
outer_join_df = df.merge(df2, how="outer", on="TeamName")
outer_join_df.to_excel("Outerjoin.xlsx",index=False)
df3 = pd.read_excel("Outerjoin.xlsx","Sheet1")
df4 = pd.read_excel("defense19.xlsx", "defense19")
outer_join_df2 = df3.merge(df4, how="outer", on="TeamName")
outer_join_df2.to_excel("Outerjoin2.xlsx",index=False)Code language: Python (python)Exploratory data analysis and descriptive statistics
I love how easy Pandas makes it to analyze and describe the training data! Early in this project I was pulling everything into arrays and using NumPy to find the coefficient correlation manually of each variable! Then I switched to Pandas and basically did all the manual work instantly. Here’s the old way where I was correlating every variable against the round 1 wins for each region.
import numpy as np
q1winper = [.8,0,.285,.285,.55,.375,.583,.333,.4545,.25,.5,1,.5,.285,.692,0]
r1win = [1,0,0,1,0,1,0,1,1,0,1,0,0,1,1,0]
np.corrcoef(q1winper,r1win)Code language: Python (python)
Then I did a little bit better by using Pandas to read in entire columns of data instead of manually creating the arrays.
import pandas as pd
import numpy as py
df = pd.read_excel("ncaa.xlsx","Sheet1")
q1winsplusattempts = df['2019_quad1_wins_plus_quad1_attempts']
r1win = df['2019_round1_win']
py.corrcoef(r1win,q1winsplusattempts)Code language: Python (python)
Finally hit it out of the park by using Pandas to import and native functions to correlate and sort according to strongest correlation!
df5 = pd.read_excel("Outerjoin2.xlsx", "Sheet1")
df6 = df5.corr()
#sort by absolute value to establish ranking by highest correlation
df6.abs().sort_values(by=['2019_round1_win'], ascending=False) Code language: Python (python)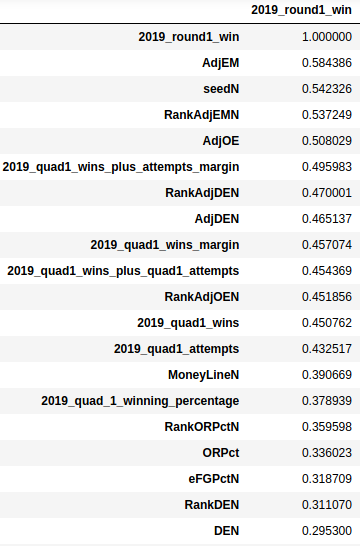
Now we have the basis on which we can build our model! For the next steps, we’ll use our Money Line odds to apply the variables that have the highest correlation with round one wins to build a model to maximize our chance of guessing the round 1 winners correctly in this year’s tournament. We’ll also calculate our expected winnings (or losings). But before I get to the conclusions, here are a few critiques.
Critiques
With the NCAA switching to NET rankings, this becomes an incredibly small training set. We essentially have only one year of tournament wins with which we build our training set. This will get better over time, but what we’re essentially saying is X variable has a strong correlation with winning last year’s first round game.
Correlation can be used for predictive purposes, but you know correlation doesn’t equal causation thing. For example, the tournament seeding awarded on Selection Sunday has the second strongest correlation of the 37 variables we looked at. Just getting a higher seed doesn’t cause you to win tournament games. I’m also very skeptical of that variable because I know how manual the selection and seeding processes are. I also think the 1 vs. 16, 2 vs. 15 matchups so rarely result in an upset that they overly sway the seeding variable, so we’re going to avoid using seeding in our final model.
Second critique here, and I’m not sure what to call this, but I may be overloading the correlation of the wins + attempts variable and some of the other variables. As an example, what I mean is adjEM takes into account adjOE so we wouldn’t necessarily want to include both in the final model. I’m going to try to keep the model as simple as possible and not “over index” it with repetitive variables.
Third, this a shallow data pool. Sure, I could very easily pull in data for each year going back to 2002, however, I’m not sure I see a meaningful enough return on the effort that would take. Are we really going to unearth a new variable in 17 years worth of games that we wouldn’t see in one year, about 35 games? I suppose it’s possible but I’m not willing to invest the time.
Lastly, remember, Vegas always wins. Any advantage we’re going to find here is going to be modest. Vegas adjusts the money line constantly — all the way until the game starts — that way they are hedging against any loss. Games that are so lopsided (1 vs. 16 matchups) usually don’t even include a money line because there’s no way for Vegas to be profitable on it. The house makes, sets, and then resets the odds in their favor! We analyzed 38 variables through occasional effort in the evenings. In Vegas you’re going up against full-time, highly experienced statisticians that include 2000+ variables and they run thousands of models to simulate each game. At the end of the day, what we’re doing is just a little more informed guessing. The house always wins. We’re left with Lady Luck. At least we feel better losing our money because we tried hard. Good try, good effort.
Conclusions
There does appear to be something to the old adage, “being battle tested and battle proven.” Playing in more quad 1 games (and winning them) does give you a better chance at winning a first round tournament game.
Adjusted Efficiency Margin looks to be the best single predictor of tournament success. No surprise here as this measure is so dang comprehensive, factoring in: pace, turnovers, shooting effectiveness, rebounding, free throws, fouling, and just about everything you can think of.
Defensive may win championships, but according to our analysis, offensive is a better predictor of first round tournament success. If in doubt, go with the team that gets more buckets!