Categories
data science

Part 2: My Future Self is Beating the Dad-Bod

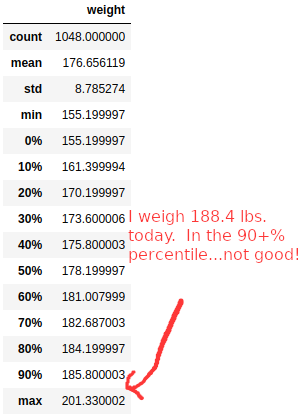
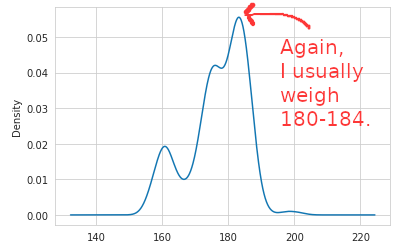
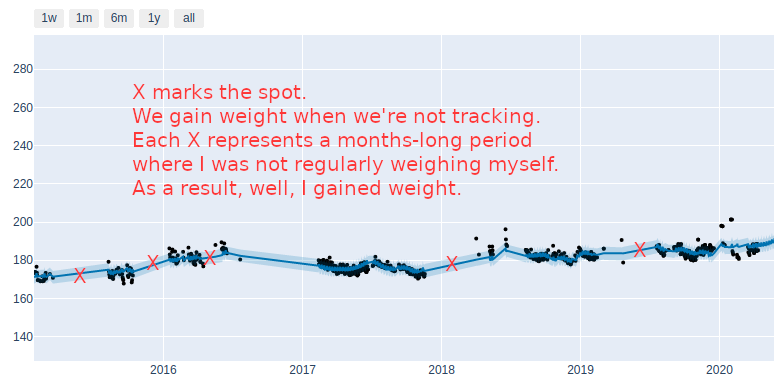
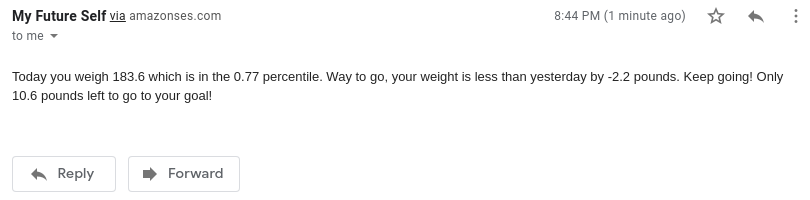
Every day right at 4pm when I should just about be getting hungry for dinner and losing motivation, I get a text message from My Future Self. The text message reminds me of my weight for today and compares it against all of the other 1048 entries I’ve logged on my scale the last decade.

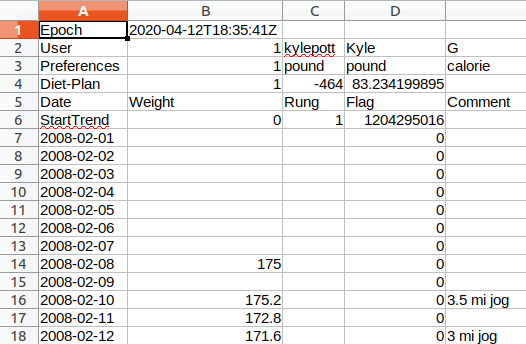
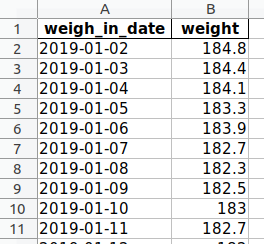
My Future Self is smart enough to compare my weight to the previous day to give some encouragement or tough love. It tracks my distance to goal, too. The percentile is also dynamic so it will always be accurate even when more entries are added. Lastly, My Future Self keeps my a journal of my daily weight reading in a nice and tidy Excel spreadsheet.

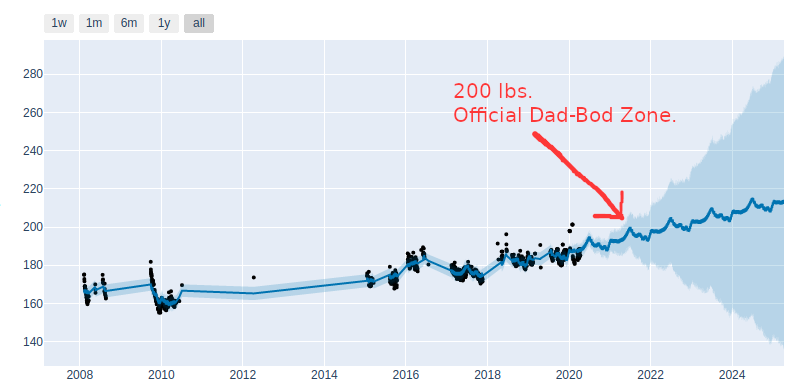
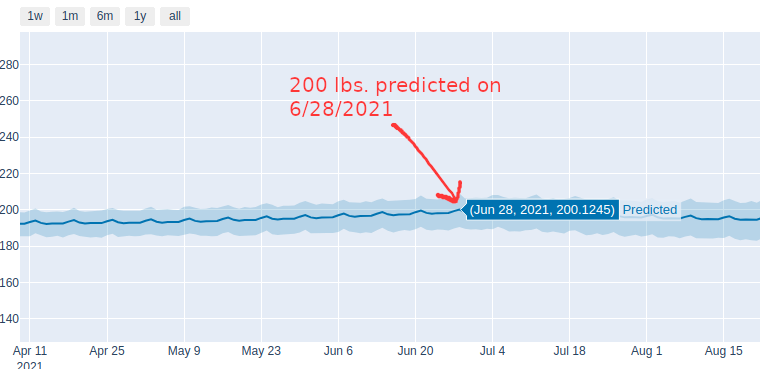
This is part 2 to my previous post. Reading part 1 will help you to understand what I’m talking about here a little bit better. In part 1 I said: I am planning to tinker with the Withings API and try to create a more real-time “scorecard” to know what percentile I’m in and if I’m delaying (and ultimately defeating) the Dad-Bod date.

I did tinker with the Withings API and I thought it was painful. So I went down another path. I wrote a screen scraper in Python using the Selenium library to get my current weight from TrendWeight. I then add the weight to my weight journal, and send myself a text message. My Future Self runs as a cron job on a free-tier EC2 instance and uses the Amazon Simple Email Service (SES) to send the email.

I will eventually add it to my GitHub repo, but here is all the code for My Future Self (warning, it’s ugly, not refactored) if you’d like to meet your future self, too.

Here’s to defeating the Dad-Bod!

import requests import urllib.request import time from bs4 import BeautifulSoup from selenium import webdriver from pyvirtualdisplay import Display import datetime from datetime import date import pandas as pd import pandas as pd2 from datetime import datetime # headless display = Display(visible=0,size=(800, 600)) display.start() #run pkill chrome to cleanup the process from the shell browser = webdriver.Chrome() browser.get("https://trendweight.com/u/91a151bdce4143/") #take a breathe allowing JavaScript to load time.sleep(2) soup = BeautifulSoup(browser.page_source, "html.parser") todays_weight = soup.findAll('td', attrs={'class':'measuredWeight'})[0].string weight_today = float(todays_weight) todayz_date = str(date.today()) #open master spreadsheet and append today's weight to the bottom. df = pd.read_excel("ThreeCleanSheets.xlsx") df2 = pd.DataFrame({"weigh_in_date":[todayz_date], "weight":[weight_today]}) df = df.append(df2) #more cleanup to remove dups df.drop_duplicates(inplace=True) #Save the updated sheet. df.to_excel('ThreeCleanSheets.xlsx',index=False) df3 = pd2.read_excel("ThreeCleanSheets.xlsx") df3['Percentile_rank']=df3.weight.rank(pct=True) #establish the index for our new weight x = (len(df3))-1 #send the email logic is next import boto3 from botocore.exceptions import ClientError # Replace sender@example.com with your "From" address. # This address must be verified with Amazon SES. SENDER = "My Future Self <kylepott@gmail.com>" # Replace recipient@example.com with a "To" address. If your account # is still in the sandbox, this address must be verified. RECIPIENT = "kylepott@gmail.com" # Specify a configuration set. If you do not want to use a configuration # set, comment the following variable, and the # ConfigurationSetName=CONFIGURATION_SET argument below. #CONFIGURATION_SET = "ConfigSet" # If necessary, replace us-west-2 with the AWS Region you're using for Amazon SES. AWS_REGION = "us-east-1" # The subject line for the email. SUBJECT = "" # The email body for recipients with non-HTML email clients. BODY_TEXT = "" weight_up_or_down = df3.weight[int(x)] - df3.weight[int(x) -1]
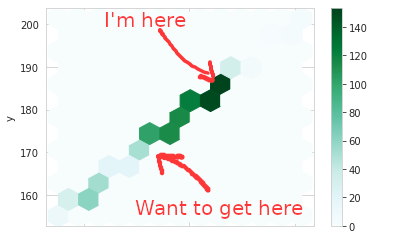
 #173 is my goal how_much_to_go = df3.weight[int(x)] - 173. # The HTML body of the email. if weight_up_or_down < 0: enouragement = " Way to go, your weight is less than yesterday by " + str(round((weight_up_or_down),2)) + " pounds." else: enouragement = " Get back at it, you can do it! Your weight was not less than yesterday. You went up" + str(round((weight_up_or_down),2)) BODY_HTML = "<html><head></head><body><p>Today you weigh " + str(round((df3.weight[int(x)]),2)) + " which is in the " + str(round((df3.Percentile_rank[int(x)]),2)) + " percentile." + enouragement + " Keep going! Only " + str(round((how_much_to_go),2)) + " pounds left to go to your goal!</p></body></html>" # The character encoding for the email. CHARSET = "UTF-8" # Create a new SES resource and specify a region. client = boto3.client('ses',region_name=AWS_REGION) # Try to send the email. try: #Provide the contents of the email. response = client.send_email( Destination={ 'ToAddresses': [ RECIPIENT, ], }, Message={ 'Body': { 'Html': { 'Charset': CHARSET, 'Data': BODY_HTML, }, 'Text': { 'Charset': CHARSET, 'Data': BODY_TEXT, }, }, 'Subject': { 'Charset': CHARSET, 'Data': SUBJECT, }, }, Source=SENDER, # If you are not using a configuration set, comment or delete the # following line #ConfigurationSetName=CONFIGURATION_SET, ) # Display an error if something goes wrong. except ClientError as e: print(e.response['Error']['Message']) else: print("Email sent! Message ID:"), print(response['MessageId'])
Code language: Python (python)

Categories
data science

According to Facebook, I Will Have a Dad-Bod on June 28, 2021

I stepped on the scale more than 1000 times in the past decade and then used Facebook’s predictive modeling framework, Prophet, to see what I will weigh in five years if I don’t make changes. At 5’9″ I’ll officially have a Dad-Bod when I pass 200 lbs. on June 28, 2021.
Note: I couldn’t help myself from using a click bait headline. The only thing Facebook has to do with this post is I used an amazing open source prediction library they created called Prophet.

Like most people in America, I have the habit of occasionally stepping on the scale. Like most people in America, that scale has been increasing since 2008. I stepped on the scale over 1000 times in the last decade. I gathered up all this data and learned somethings about myself.

To continue building my Data Science skills, I used Python to wrangle and clean the data, visualize the data, predict likely and possible outcomes, and drew conclusions about my habits. To keep things short, I’ll jump right to conclusions *that apply to me* then go in depth below on analysis techniques, explanations, and next steps.

Conclusions

  • Weight gain is an insidious monster.
  • Weight gain happens when we’re not looking (not stepping on the scale each day).
  • Weight gain is seasonal.
  • Wednesday is a pivotal day in the week for weight loss progress.
  • I control my own destiny in the future. Update, in Part 2, I create a tool, My Future Self, to defeat the Dad-Bod

Wrangling the Data

Since 2008 I used four different tools to track my weight: Hacker’s Diet Online, Weightbot (app retired, all data lost), MyFitnessPal, and TrendWeight. I was able to export, clean, and concatenate data from three of the four. Here’s the Python code I used to get a two column .csv with dates on the left and weights on the right. Update: see the GitHub repository below for the code. No judgment please, the code is not clean and could stand a good refactoring.

I started with the Hacker’s Diet data which was very poorly formatted (see the image below). Then I repeated the process with MyFitnessPal, which was better and finally TrendWeight which was in the best shape. TrendWeight is my current favorite tool for tracking weight as it has a tremendous amount of detail and also integrates seamlessly with my Withings wifi scale. The first part of this project was an art of renaming columns, removing null entries, removing repeating column headers, and selectively converting kg to lbs for the month or so I thought logging my weight in kgs would somehow be helpful (it wasn’t). Then I concatenated everything using an outer join to make sure I had only unique data and nothing repeating.

This is a sample of the ugly
This is an ugly csv file.

Now, we have a nice looking and easy to manage csv file with 1048 entries that we can work with for analysis and visualization.

This is a nice csv file.

Update: Originally, I included all the Python code in this post, but it got pretty lengthy. Instead, I created a new open source GitHub project if you want to download my work and use it yourself (GNU General Public License v3). Here is a direct link to a PDF of my Jupyter notebook if you’d like to follow my work step by step.

Describe the Data

After getting everything cleaned up, I started with a few basic techniques to learn more about the data.

Basic describe() function in Python gives us a good summary of the data. I binned the weights into tenths to help see the spread and give myself some targets for improvement.
I lost a lot of data from 2011 – 2015 which sucks. But, you don’t have to be a data scientist to mentally add a best fit line and see we have a problem. The weights are going up and to the right.

Before coming down on myself too harshly, there are two bits of qualitative information to keep in mind. This data set covers 12+ years of my life from ages 23 to 35 and ranges 46.1 pounds from a low of 155.2 to a high of 201.3.

1.) I’ll start with a bit of an anecdotal observation. I think there is something to consider that a 23 year old male, me, just finishing college and getting started in the real world may not be done growing. I would imagine if we studied populations, very few people would weigh the same at 30, 40, 50+ as they did at 23. That’s not to suggest that everyone becomes more unhealthy as they age (adding body fat), but just an acknowledgement that a low weight I achieved in 2009 of 155 lbs. at age 24 may not be possible to achieve ever again. It just may not be possible. (more on this below).

2.) I started lifting weights regularly at the end of 2011. Unfortunately, the first four years of data from when I started lifting weights is gone and unrecoverable. However, I think it is fair to say that at a very conservative rate of growth, I could add 1-2 pounds of muscle every year. That might make a new plausible low weight for me to be 164-173. That assumes adding 1-2 pounds of muscle per year and that would be a *low* weight between the 10th and 30th percentiles of all weights I’ve ever weighed in my entire adult life.

Note: when I say I started lifting weights, intensity, effort, and consistency factor in. I competed in a powerlifting meet and achieved a 1000+ lb. total (bench, squad, dead lift). I’m not an elite athlete, but just to put in context when I say I might be able to add 2 pounds of muscle per year, it’s the backing to suggest this is plausible.

Thank you actual Facebook for helping me unearth this gem.

With such a wide range of possible weights, I thought it would be helpful to bin them and drop the data into a histogram. I learned that I weigh 180-184 nearly 1/3 of the time. This is good to know to help with the mental anguish of weight loss. Shouldn’t I weigh 155-160?! Actually, no I shouldn’t, because I almost never weighed that much (less than 6% of all weigh ins in 12 years). Also, it helps with setting a near term goal: get to a weight of < 180 and I’m already in the 50-60 percentile. Then get to 178 and I’m in the 40%, 175 and I’m in the 30%. We’re not talking huge numbers of pounds to lose here.

We can explain this concept in another way by showing a density chart. My greatest densities are in alignment with what we just discussed 180-184 lbs. then 179 lbs.

Another way of showing the same concept using hexbins. Where I am and then where I think I’d like to get to for the long haul.

Cycles of Weight Gain and Loss

Whereas most people try to look better in their swimsuits, apparently I prefer to look thicker in my swimsuit. You know, to fill it out, I guess. After a modest downward tick after New Years, you can see a climb up that peaks around the 4th of July and then a steady weight loss through the end of summer, start of Fall, and just before the holidays. Then about a five pound weight gain through the holidays.

The Facebook Prophet library makes analyzing seasonality incredibly easy!

When we look at “seasonality” applied to each week, we learn more helpful insights about my habits. In order to reverse the trend here, I need to do better on Wednesdays and soften the weekend peaks. We have a bad data problem shown here. I have recorded very few weigh ins on Saturdays so that day of the week is not well represented. Presumably, because I eat a lot on Friday nights and I’m not all that interested in stepping on the scale at the start of the weekend. Another “now” habit to establish.

We Gain Weight When We’re Not Looking

There are a few exceptions, but unsurprisingly, long periods where I was not stepping on the scale resulted in prolonged increases in my weight.

Red Xs mark long periods where I was not weighing myself and led to weight gain. Notice each cluster of black dots shows a distinct downward trajectory. In other words, stepping on the scale each day is enough to suggest I care about my health and results. It’s not so much about having a perfect nutrition plan, but simply stepping on the scale each morning is going to help me focus on making better choices throughout the day and ultimately lead to results. Consistency matters – no surprise there.

Recipe for Success

I loved the book Atomic Habits. One of my top 10 favorite books. Author, James Clear, makes the case that to successfully establish new habits we need to break the trigger action down to the simplest, lowest level. Following that advice, here’s what I learned from this project that I will put into practice.

1.) Step on the scale every day. Even if I know I’m not going to like the results.

2.) Wednesdays are the day I will be most focused on my nutrition because it’s sets the tone for the week. No cheat days on Wednesdays.

3.) Set small goals, and keep working my way down the ladder. For me that means get to the next bin: 90th percentile is 185, 80th is 184, 70th percentile is 182, etc. until I arrive at the target range which is the 30% or 173. Update: Read Part 2 to see the system I set in place with a daily text message to remind me and give some encouragement.

Final Thoughts

We control our own destiny – I meant for this post to be equally heavy on accountability and inspiration – we can achieve anything we set our minds to. Take a look at this last visual and look how the prediction splits toward either success and failure. There’s a quote I like that captures it:

You’re either growing or you’re decaying.

Unknown
What the next five years holds is up to me.

(Potential) Next Steps

  • I uploaded my Python code into GitHub if you’d like to geek out on this stuff yourself.
  • One critique of my analysis is that weight (alone) does not tell the whole story (lean mass vs. fat mass). This is true and one of the reasons I love using the Withings scale with TrendWeight is that I have detailed lean/fat mass readings going back to 2018. I may dive into this in more detail, but I am somewhat skeptical about the accuracy of these readings. Nevertheless, it’s something to consider exploring.
  • I am planning to tinker with the Withings API and try to create a more real-time “scorecard” to know what percentile I’m in and if I’m delaying (and ultimately defeating) the Dad-Bod date. Update: This is done. Read Part 2.
  • If there’s enough interest, I’ll consider creating a web app that you can upload your own MyFitnessPal data and then get a similar set of visuals about your own data.
  • Thank you to the Facebook engineers that created Prophet. I really enjoyed using it.